Technology
LEO Latency vs GEO Latency: Technical Analysis and Industry Implications
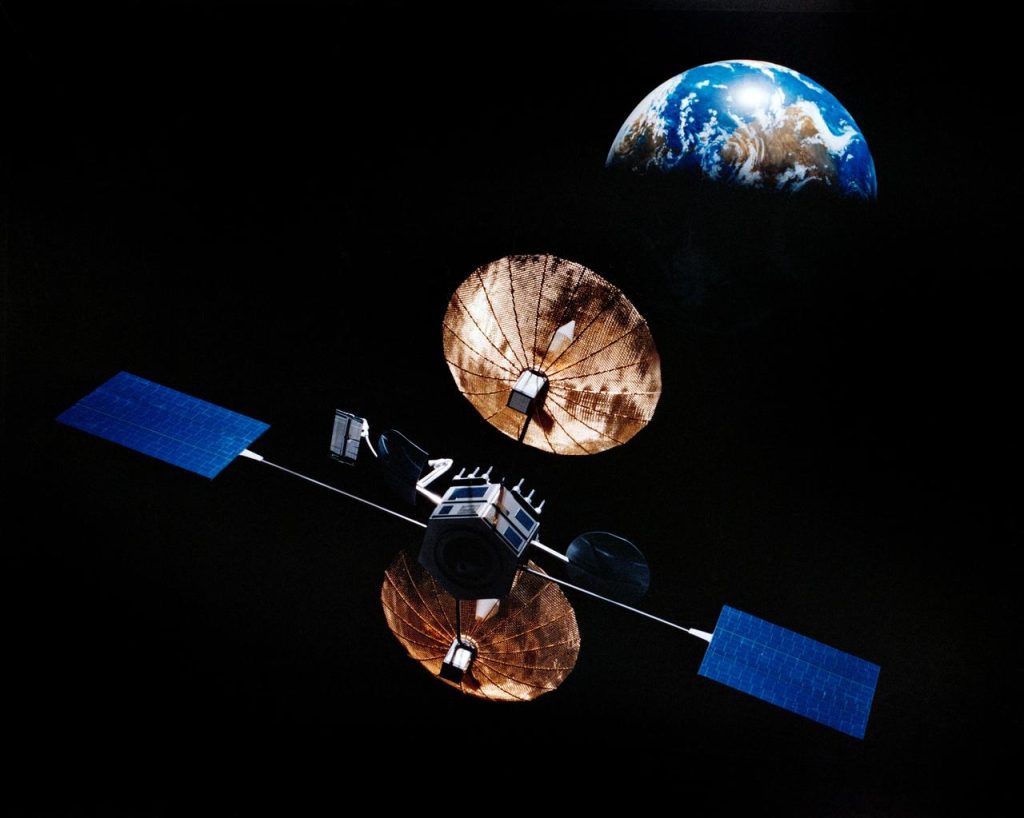
GEO carries a 477 ms physics floor no roadmap can lower; LEO's floor is 7 ms and falling toward it. The full technical analysis:…
GEO carries a 477 ms physics floor no roadmap can lower; LEO's floor is 7 ms and falling toward it. The full technical analysis:…
10,722 working satellites, 10.3M subscribers, ~$15.5B projected revenue — and a replacement cycle that can never stop. Inside the Starlink machine: the architecture, the…
The flagship mid-year report, updated with July 2026 data: 13,972 active LEO payloads, Starlink at 10.3M subscribers and ~$15.5B projected revenue, the Amazon Leo…
The LEO connectivity market has sorted into four strategic groups — and competition happens within them, not between them. Who holds which moat, why…
Analyst consensus puts LEO connectivity revenue above $16B for 2026 — but the segment mix matters more than the headline. The full market report:…
Fifty-plus terms that decide contracts, filings and valuations in the LEO sector — orbits, constellation architecture, spectrum, regulation and the business metrics that matter…
LEO, MEO and GEO are converging into layers of one network stack. The full comparison: ~480 ms of unavoidable GEO physics vs 25–60 ms…
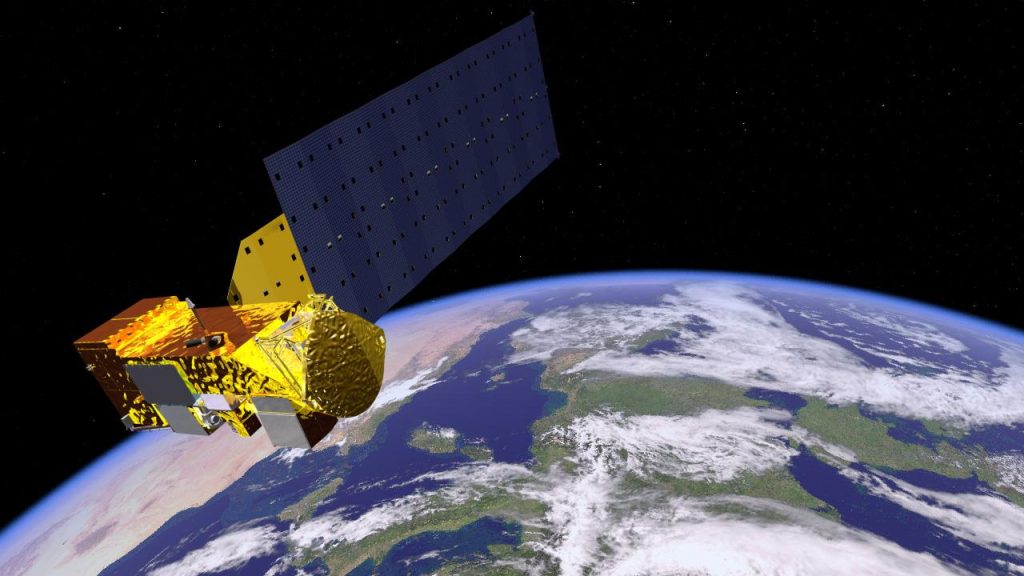
LEO is now the default architecture for satellite connectivity: 75%+ of active satellites, 25–60 ms latency competing with terrestrial networks, and launch costs an…